
Upper 30% of supported scores
Regional review zones
559.43 km²Examine the full response and its regional geological setting.
Bynoe–Finniss · 28 September 2026 analysis
Broader response areas, original source context and separate model and chemistry views. Use each map for the question it can answer.
Public case study · analysis updated 28 September 2026
Ask a question. Inspect the evidence.
Compare the same area through its sources, model responses and evidence gaps. Each map answers a different question.
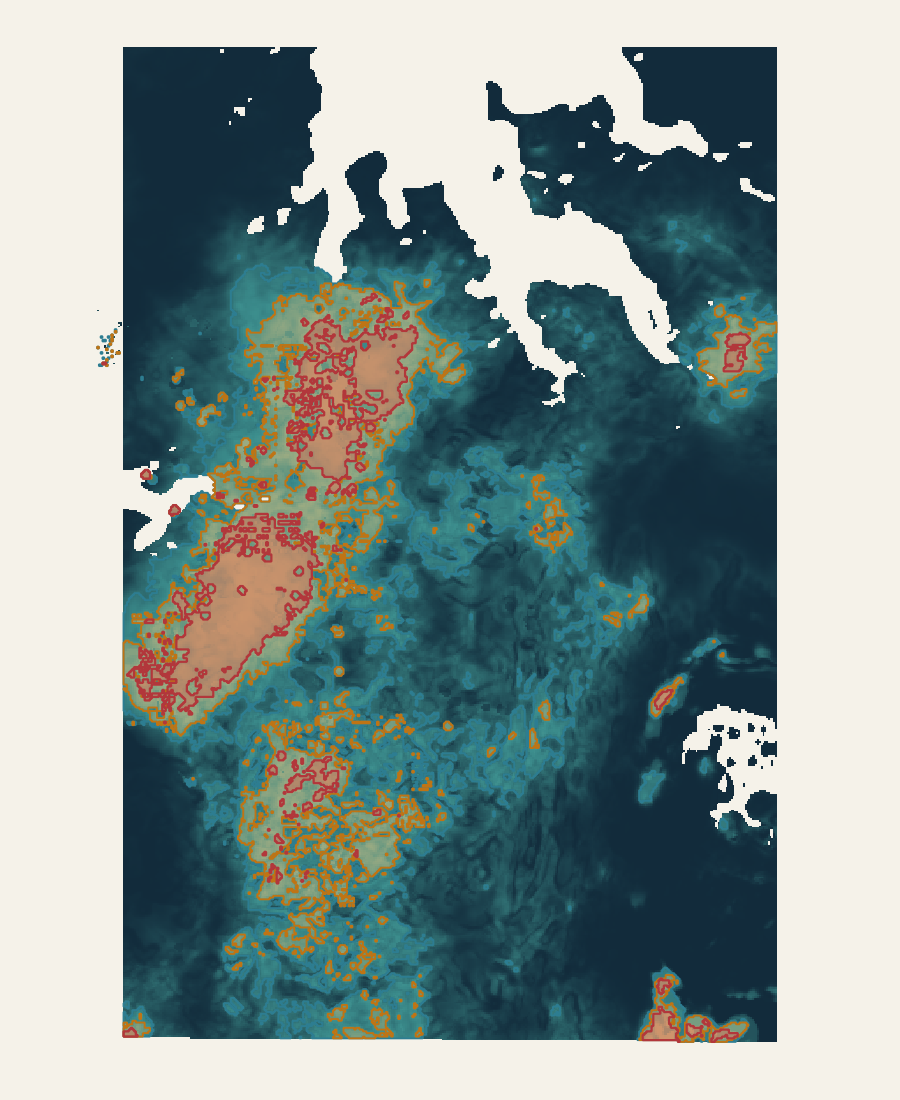
Exploratory combination
The combined view keeps broad regional zones, investigation areas and strong cores together. Use it to plan the next review at the right scale.
4.29e-10dimensionless score1.00
Regional · 30% Investigation · 15% Core · 5%
Read it with family coverage and disagreement. Its outlines belong to this combined response, not to every model map.
LodeCraft analysis · 28 September 2026 · North up · Blank physical/model cells lack a displayed supported value. Read each legend separately.Open full-size map ↗From broad ground to focused investigation
Upper 30% of supported scores
Examine the full response and its regional geological setting.
Upper 15% of supported scores
Organise detailed source review and potential field follow-up.
Upper 5% of supported scores
Inspect the strongest parts within their wider context.
These areas are nested, not additive. Threshold ties are retained and missing coverage is not bridged. The percentages describe relative responses—not the chance of finding a deposit.
Different evidence. Clear roles.
Geoscience Australia magnetic TMI, Bouguer gravity and potassium, uranium and thorium radiometric grids. Physical representations are compared across seven arms, A0–A6.
NTGS Darwin 1:250,000 mapping: 38 literal mapped-unit proximity inputs plus contacts, faults and lineaments. The same 41 context inputs enter both fixed model branches in each arm. Proximity does not establish fertility.
Boron, beryllium, caesium, fluorine, niobium, phosphorus, rubidium, tin and tantalum feed a separate anomaly workflow. Sample type, qualifiers, method and spatial support remain attached. Lithium assay observations are distinct from these nine non-lithium inputs; historical laboratory quality remains a limitation.
Two fixed positive–unlabelled branches learn a provisional source-reported LCT-affinity endpoint while unknown ground remains unlabelled. Six fusion methods consume spatially held development predictions. The exploratory combination is a separate review product with coverage and family disagreement.
Bagged PU logistic and non-negative PU logistic use seeds 17, 29 and 43. Working maps fit 90 development rows and exclude 20 final rows. This delivery establishes no new final-holdout test, independent performance estimate or calibrated probability.
All arms retain the original partitions and 5 km exclusion. That separation is below the previously measured approximately 27 km autocorrelation range, limiting independent regional generalisation. A2 and A3 have equivalent candidate libraries; method counts are not independent votes.
The display grid is 100 m; effective source floor is 500 m. Geology is mapped at 1:250,000. Grid spacing and map scale do not establish positional uncertainty.
Graph methods remain experimental node representations, not continuous prospectivity maps. Earlier satellite and structural-complexity studies retain their historical roles; they are not additional predictive inputs.
Sources: Geoscience Australia 2019 Magmap TMI, Gravmap2019 Bouguer gravity and filtered Radmap K/U/Th; NTGS Darwin geological mapping and DIP001 reported geochemistry. Source attribution and usage terms remain attached to their original records.
NTGS geoscience records ↗ · Geoscience Australia portal ↗
Scientific execution record SHA-256: a56bcce2e9e97536214e6ea23d46fc019c3059d98d783e97cce510633760624e
The end product
The handover is a working review package: a curated model project, a source-context companion and an offline atlas. Your geologists can switch between evidence views, inspect the wider areas and continue their review in QGIS without rebuilding the processing workspace.
Combined areas, predictive responses, alternative fusion views, geochemical anomalies and support. 36 selected layers keep the processing inventory out of the customer workspace.
Selected geological, structural and physical inputs are kept distinct from model results. These include six of the 38 mapped-unit proximity layers.
Plain-language reading guidance accompanies the two QGIS projects and their source-bound analytical records.
All 50 selected layers reopened with portable local paths and no broken sources. This checks technical usability, not mineral discovery. Detailed GIS access is request-based; agreed customer deliverables depend on the question, available evidence and written scope.