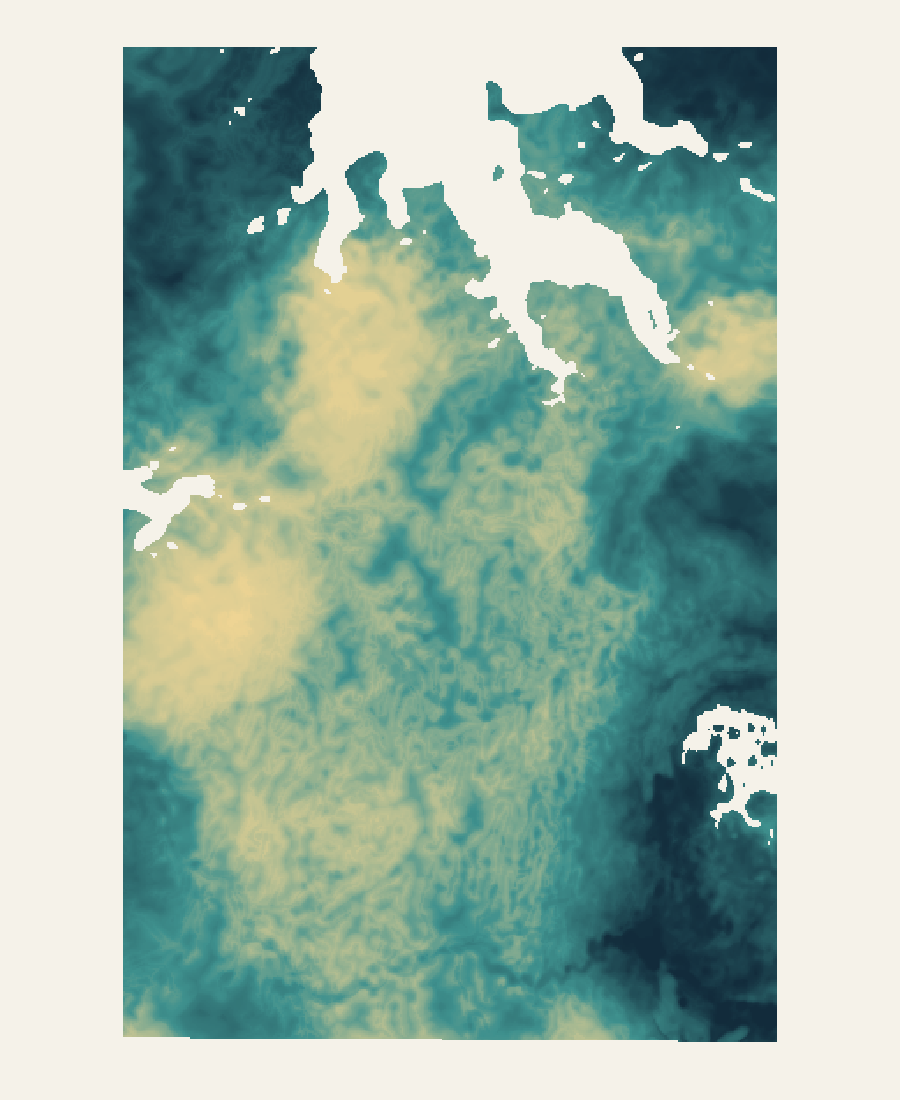
Bynoe–Finniss, Northern Territory · 28 September 2026 analysis
Know where to investigate next —and why.
Across Bynoe, the combined response extends beyond the strongest local peaks. LodeCraft preserves that wider ground, then shows the geological setting, model responses and chemical evidence available to investigate it.
Your budget has to cover both understanding the ground and testing it. LodeCraft connects the available data, ML/DL analysis and source review in a reusable package—designed to reduce repeated desk work and make the purpose of the next field spend clearer.
Regional decision support. Highlighted areas are review hypotheses, not confirmed mineralisation or discovery probabilities.
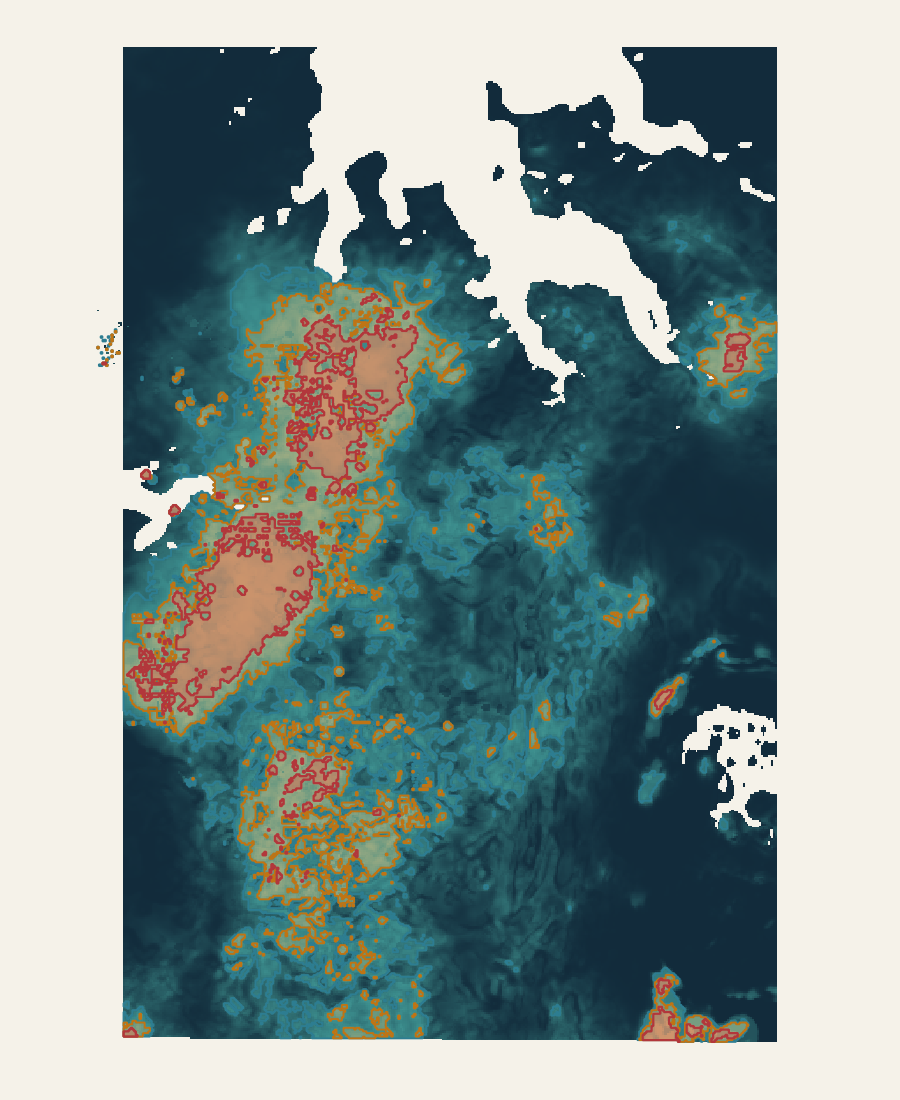
The wider response stays visible.Combined exploratory score · approximately 0–1 · north up · coordinate-free previewRegional Investigation Core
The customer problem
More data should not mean more work before every decision.
Exploration teams need to decide where to look more closely while managing limited time and budgets. When sources, models and maps stay separate, the same preparation gets repeated and the reason for the next survey or sampling programme can remain unclear.
Spend less time assembling the review.
Source context, model responses and supporting records come together in an inspectable package. The intended saving is fewer repeated steps preparing maps, finding references and explaining how an output was produced.
Give each field spend a clear purpose.
Broader areas, model differences and coverage gaps help define what mapping, sampling or a survey should resolve. A more specific question can help avoid commissioning work that does not address the uncertainty.
Keep the work usable after handover.
Curated QGIS projects and a plain-language atlas let the team continue reviewing the evidence without reconstructing the processing workspace. The next reviewer can start from the same sources and maps.
Bynoe demonstrates the connected workflow and deliverables. Customer hours, dollars and fieldwork savings have not been measured in this study; actual savings depend on data readiness, project scope and how the team uses the results.
The Bynoe story · five connected views
From scattered evidence to a better-defined next step.
The combined Bynoe response extends beyond its strongest local peaks. These five maps show how we put that pattern in context and turn it into questions an exploration team can act on.
01 · Establish the setting
Start with the ground, before the score.
The customer problem. Geological maps, survey grids and reports often arrive in different formats and at different scales. A team can spend its review time assembling information before it can ask a useful geological question.
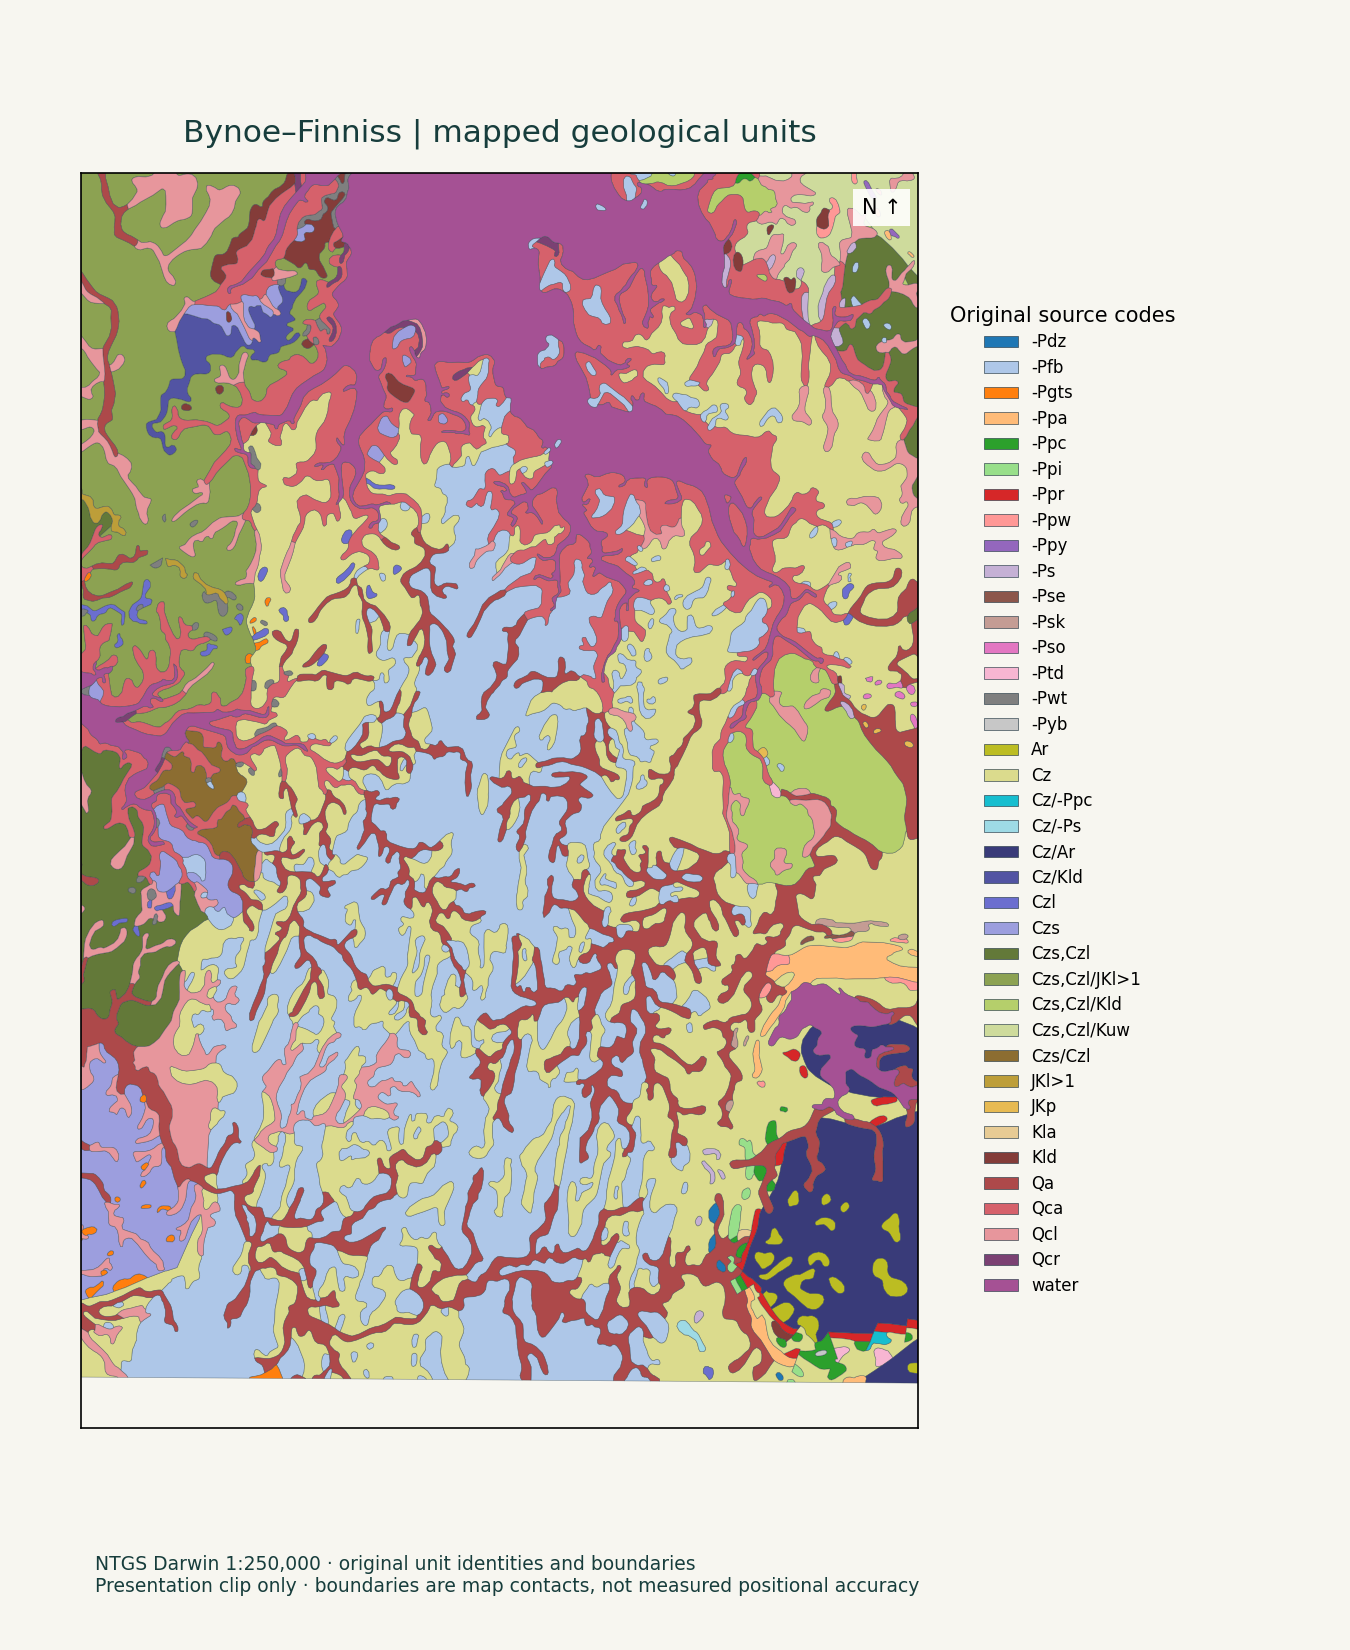
What we did at Bynoe. At Bynoe, we retained all 38 original mapped-unit codes and connected geological context to the models. The original map stays visible so a geologist can examine formations and contacts alongside the responses.
The next useful decision. Use one shared geological reference to identify the source reports or finer mapping needed for an area. That reduces the need to rebuild the same context for each review.
This is original 1:250,000 source mapping. It does not establish concealed geology, local boundary precision or granite fertility.
Original source mappingNTGS Darwin 1:250,000 · North upOpen the map for the full-size view. Read each colour range separately.
02 · Put structures in context
Make the next mapping question specific.
The customer problem. A structural layer alone does not explain whether a mapped feature relates to the physical response that caught the team's attention.
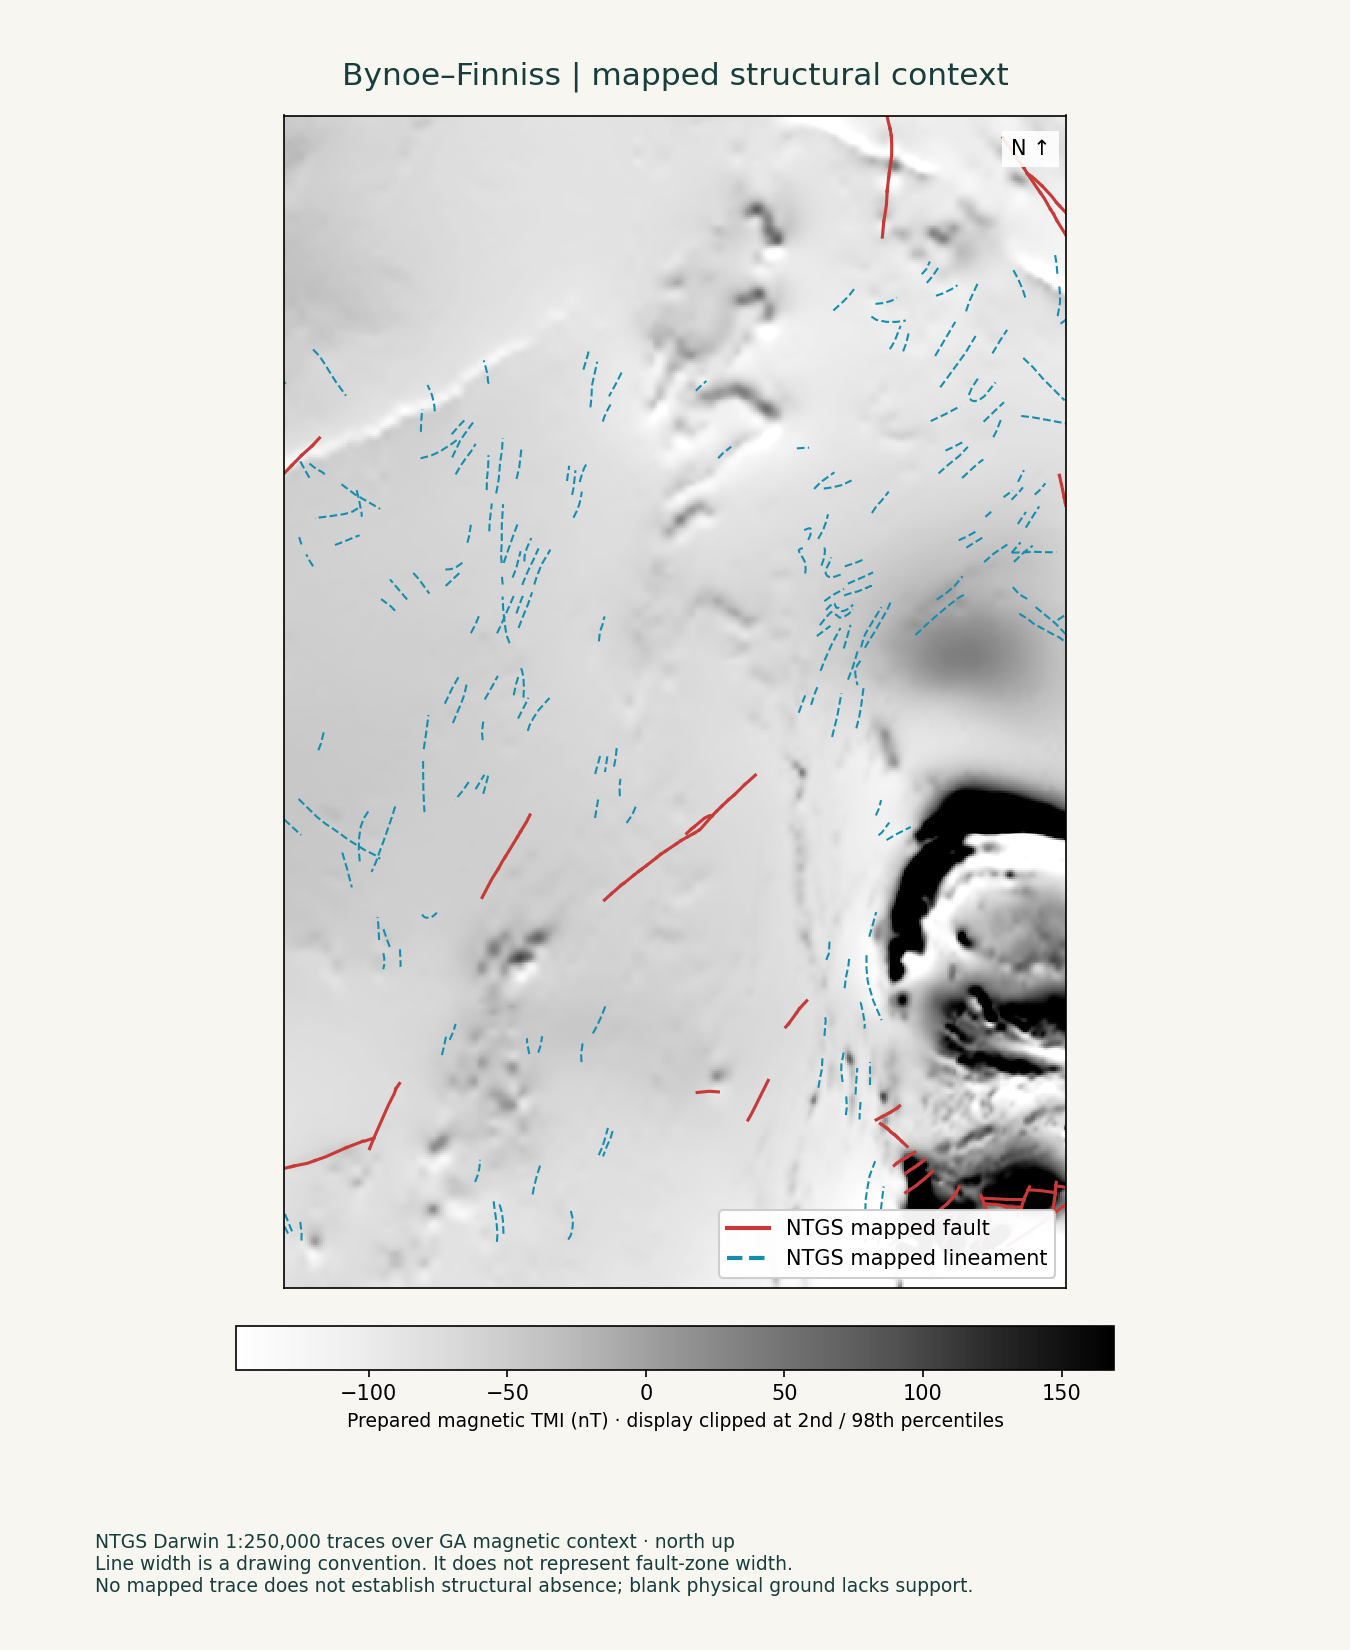
What we did at Bynoe. We show the recorded faults and lineaments over magnetics. Actual mapped traces remain distinct from distance-to-fault inputs, so a broad model band is not mistaken for a wide fault zone.
The next useful decision. Frame a concrete mapping or survey question before mobilising: which relationship needs checking, and what level of detail would resolve it?
These are mapped traces, not newly confirmed structures. Line width does not show fault-zone width, and an unmarked area may still contain unmapped structures.
Original source traces + physical contextNTGS Darwin mapping / GA magnetic grid · North upRed solid: mapped faults · Blue dashed: mapped lineaments · Grey: magnetic responseOpen the map for the full-size view. Read each colour range separately.
03 · Connect the model inputs
Turn separate datasets into a response you can inspect.
The customer problem. Producing several attractive maps is only useful if the team can explain which evidence actually contributes to the result.
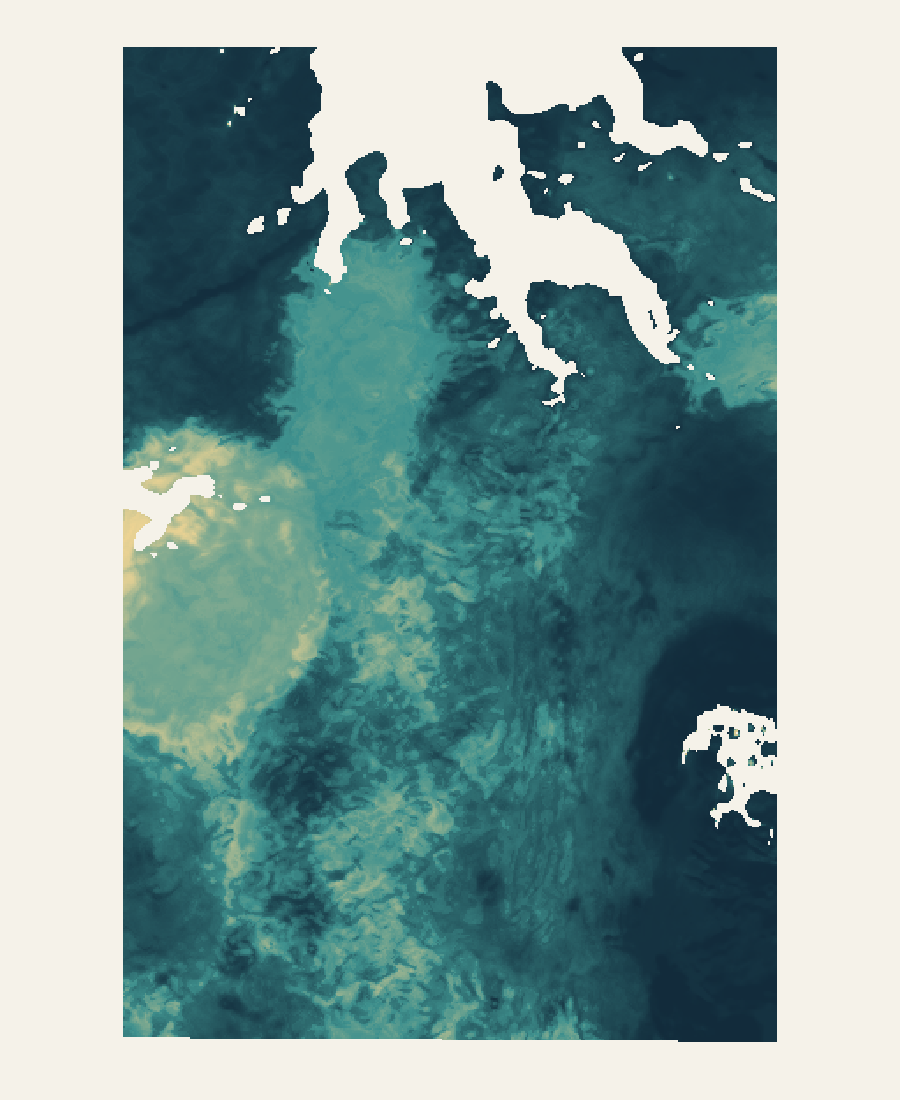
What we did at Bynoe. The A3 view connects physical representations with 41 geological and structural context inputs. The combination model uses predictions for spatially held development rows, which were excluded from the corresponding model fits. The source-to-model-to-target connections were checked.
The next useful decision. Review connected evidence instead of manually reconciling separate processing outputs. Use the response to focus a geological question, then inspect the sources behind it.
The response estimates provisional source-reported lithium–caesium–tantalum (LCT) affinity. It is not a calibrated discovery probability or independently demonstrated predictive performance.
Predictive fusion · working mapLodeCraft analysis · 28 September 2026 · North up
0.00127dimensionless score0.893
Open the map for the full-size view. Read each colour range separately.
04 · Compare alternatives
See what changes before you spend on follow-up.
The customer problem. One combined score can hide how much the result depends on the modelling and combination choices.
What we did at Bynoe. The A0 uncertainty-aware combination provides an alternative view beside A3. Similarities and differences remain available for review. Both the representation and combination method differ, so this comparison does not isolate the effect of one method.
The next useful decision. Use differences to identify where source checking, mapping or sampling could change the interpretation. This helps define the purpose of the next spend before committing to a larger programme.
The views share underlying evidence, so agreement is not independent confirmation. Read each map's colour range separately; an uncertainty-aware score is not calibrated geological confidence.
A0 uncertainty-aware fusionLodeCraft analysis · 28 September 2026 · North up
0.00dimensionless score1.00
Open the map for the full-size view. Read each colour range separately.
05 · Plan at the right scale
Keep the wider ground around a promising response.
The customer problem. A shortlist of small peaks can leave a team without the regional context needed to plan sensible follow-up.
What we did at Bynoe. At Bynoe, the combined exploratory response extends beyond the strongest cores. We preserve that extent as linked regional zones, investigation areas and strong cores using the nominal upper 30%, 15% and 5% of supported scores.
The next useful decision. Discuss regional mapping, detailed investigation and focused sampling at different scales. Carry the full response into QGIS so a small shortlist does not erase broader ground worth reviewing.
The upper 30%, 15% and 5% bands describe relative supported scores, not discovery probabilities. Chemistry coverage is uneven; check coverage and disagreement in the detailed study.
Exploratory combinationLodeCraft analysis · 28 September 2026 · North up
4.29e-10dimensionless score1.00
Regional 30% Investigation 15% Core 5%Open the map for the full-size view. Read each colour range separately.
The display grid is 100 m; the effective physical-source resolution floor is 500 m. Original geology is mapped at 1:250,000. Blank model cells lack a displayed supported value. The maps support review and follow-up planning; they do not establish a drilling order.
Examine the full response and its regional geological setting.
Upper 15% of supported scores
Investigation areas
279.72 km²
Organise detailed source review and potential field follow-up.
Upper 5% of supported scores
Strong response cores
93.24 km²
Inspect the strongest parts within their wider context.
These areas are nested, not additive. Threshold ties are retained and missing coverage is not bridged. The percentages describe relative responses—not the chance of finding a deposit.
What ML, deep learning and AI contribute
Different tools. A clear job for each.
Machine learning connects the inputs.
Two fixed model branches use physical, geological and structural information to estimate provisional source-reported lithium–caesium–tantalum (LCT) affinity. Unknown ground stays unlabelled. Six combination methods make alternative responses available for review.
Useful for: comparing complex spatial patterns consistently and tracing what reaches the working maps.
Deep learning flags unusual chemistry.
A separate neural analysis highlights chemical combinations that differ from learned patterns in nine non-lithium elements. Its anomaly map, baseline comparison and support map remain available in the detailed study.
Useful for: identifying chemical patterns to inspect. A neural anomaly is not a measurement of lithium grade or proof of fertile rock.
AI assists evidence review.
AI-assisted work helps organise source references, check factual consistency and prepare explanations for human review. Geological observations, model patterns and possible interpretations remain distinct.
Useful for: making a large evidence package easier to navigate. AI review does not replace geological judgement or independent validation.
The five featured maps show source context and model or combined responses; they are not all deep-learning outputs. The Bynoe working maps do not establish independent predictive performance or calibrated discovery probabilities.
Different evidence. Clear roles.
What went into the work.
Physical measurements
Geoscience Australia magnetic TMI, Bouguer gravity and potassium, uranium and thorium radiometric grids. Physical representations are compared across seven arms, A0–A6.
Geology and structures
NTGS Darwin 1:250,000 mapping: 38 literal mapped-unit proximity inputs plus contacts, faults and lineaments. The same 41 context inputs enter both fixed model branches in each arm. Proximity does not establish fertility.
Reported geochemistry
Boron, beryllium, caesium, fluorine, niobium, phosphorus, rubidium, tin and tantalum feed a separate anomaly workflow. Sample type, qualifiers, method and spatial support remain attached. Lithium assay observations are distinct from these nine non-lithium inputs; historical laboratory quality remains a limitation.
Models and combination
Two fixed positive–unlabelled branches learn a provisional source-reported LCT-affinity endpoint while unknown ground remains unlabelled. Six fusion methods consume spatially held development predictions. The exploratory combination is a separate review product with coverage and family disagreement.
Model design, source scale and evidence limits
Bagged PU logistic and non-negative PU logistic use seeds 17, 29 and 43. Working maps fit 90 development rows and exclude 20 final rows. This delivery establishes no new final-holdout test, independent performance estimate or calibrated probability.
All arms retain the original partitions and 5 km exclusion. That separation is below the previously measured approximately 27 km autocorrelation range, limiting independent regional generalisation. A2 and A3 have equivalent candidate libraries; method counts are not independent votes.
The display grid is 100 m; effective source floor is 500 m. Geology is mapped at 1:250,000. Grid spacing and map scale do not establish positional uncertainty.
Graph methods remain experimental node representations, not continuous prospectivity maps. Earlier satellite and structural-complexity studies retain their historical roles; they are not additional predictive inputs.
Sources: Geoscience Australia 2019 Magmap TMI, Gravmap2019 Bouguer gravity and filtered Radmap K/U/Th; NTGS Darwin geological mapping and DIP001 reported geochemistry. Source attribution and usage terms remain attached to their original records.
Scientific execution record SHA-256: a56bcce2e9e97536214e6ea23d46fc019c3059d98d783e97cce510633760624e
The end product
Open the project. Follow the reasoning.
The handover is a working review package: a curated model project, a source-context companion and an offline atlas. Your geologists can switch between evidence views, inspect the wider areas and continue their review in QGIS without rebuilding the processing workspace.
Actual QGIS map-theme export · Combined evidence and nested areas. The projects include selectable themes for the other views below.
27
Model map themes
Combined areas, predictive responses, alternative fusion views, geochemical anomalies and support. 36 selected layers keep the processing inventory out of the customer workspace.
14
Source-context views
Selected geological, structural and physical inputs are kept distinct from model results. These include six of the 38 mapped-unit proximity layers.
41
Views explained in one atlas
Plain-language reading guidance accompanies the two QGIS projects and their source-bound analytical records.
All 50 selected layers reopened with portable local paths and no broken sources. This checks technical usability, not mineral discovery. Detailed GIS access is request-based; agreed customer deliverables depend on the question, available evidence and written scope.
The next useful decision
Turn a response into a review question.
Inspect the useful areas against source reports and project-scale geology, then design proportionate mapping, sampling or survey follow-up. Regional scale and uneven chemistry coverage limit local interpretation; the maps do not establish a drilling order.
What decision does your exploration team need to make next?
Bring a non-confidential summary of your area, commodity, available data and the decision you need to support. We will discuss fit and define an appropriate scope before analysis begins.