Skip to content
MindSync Technologies
← All case studies

LodeCraft / Yamarna, Western Australia / Gold

Historical data.
A fresh exploration view.

At Bloodwood and Renegade South, current candidate areas overlap recorded prospects where published drilling postdates our dated development assays.

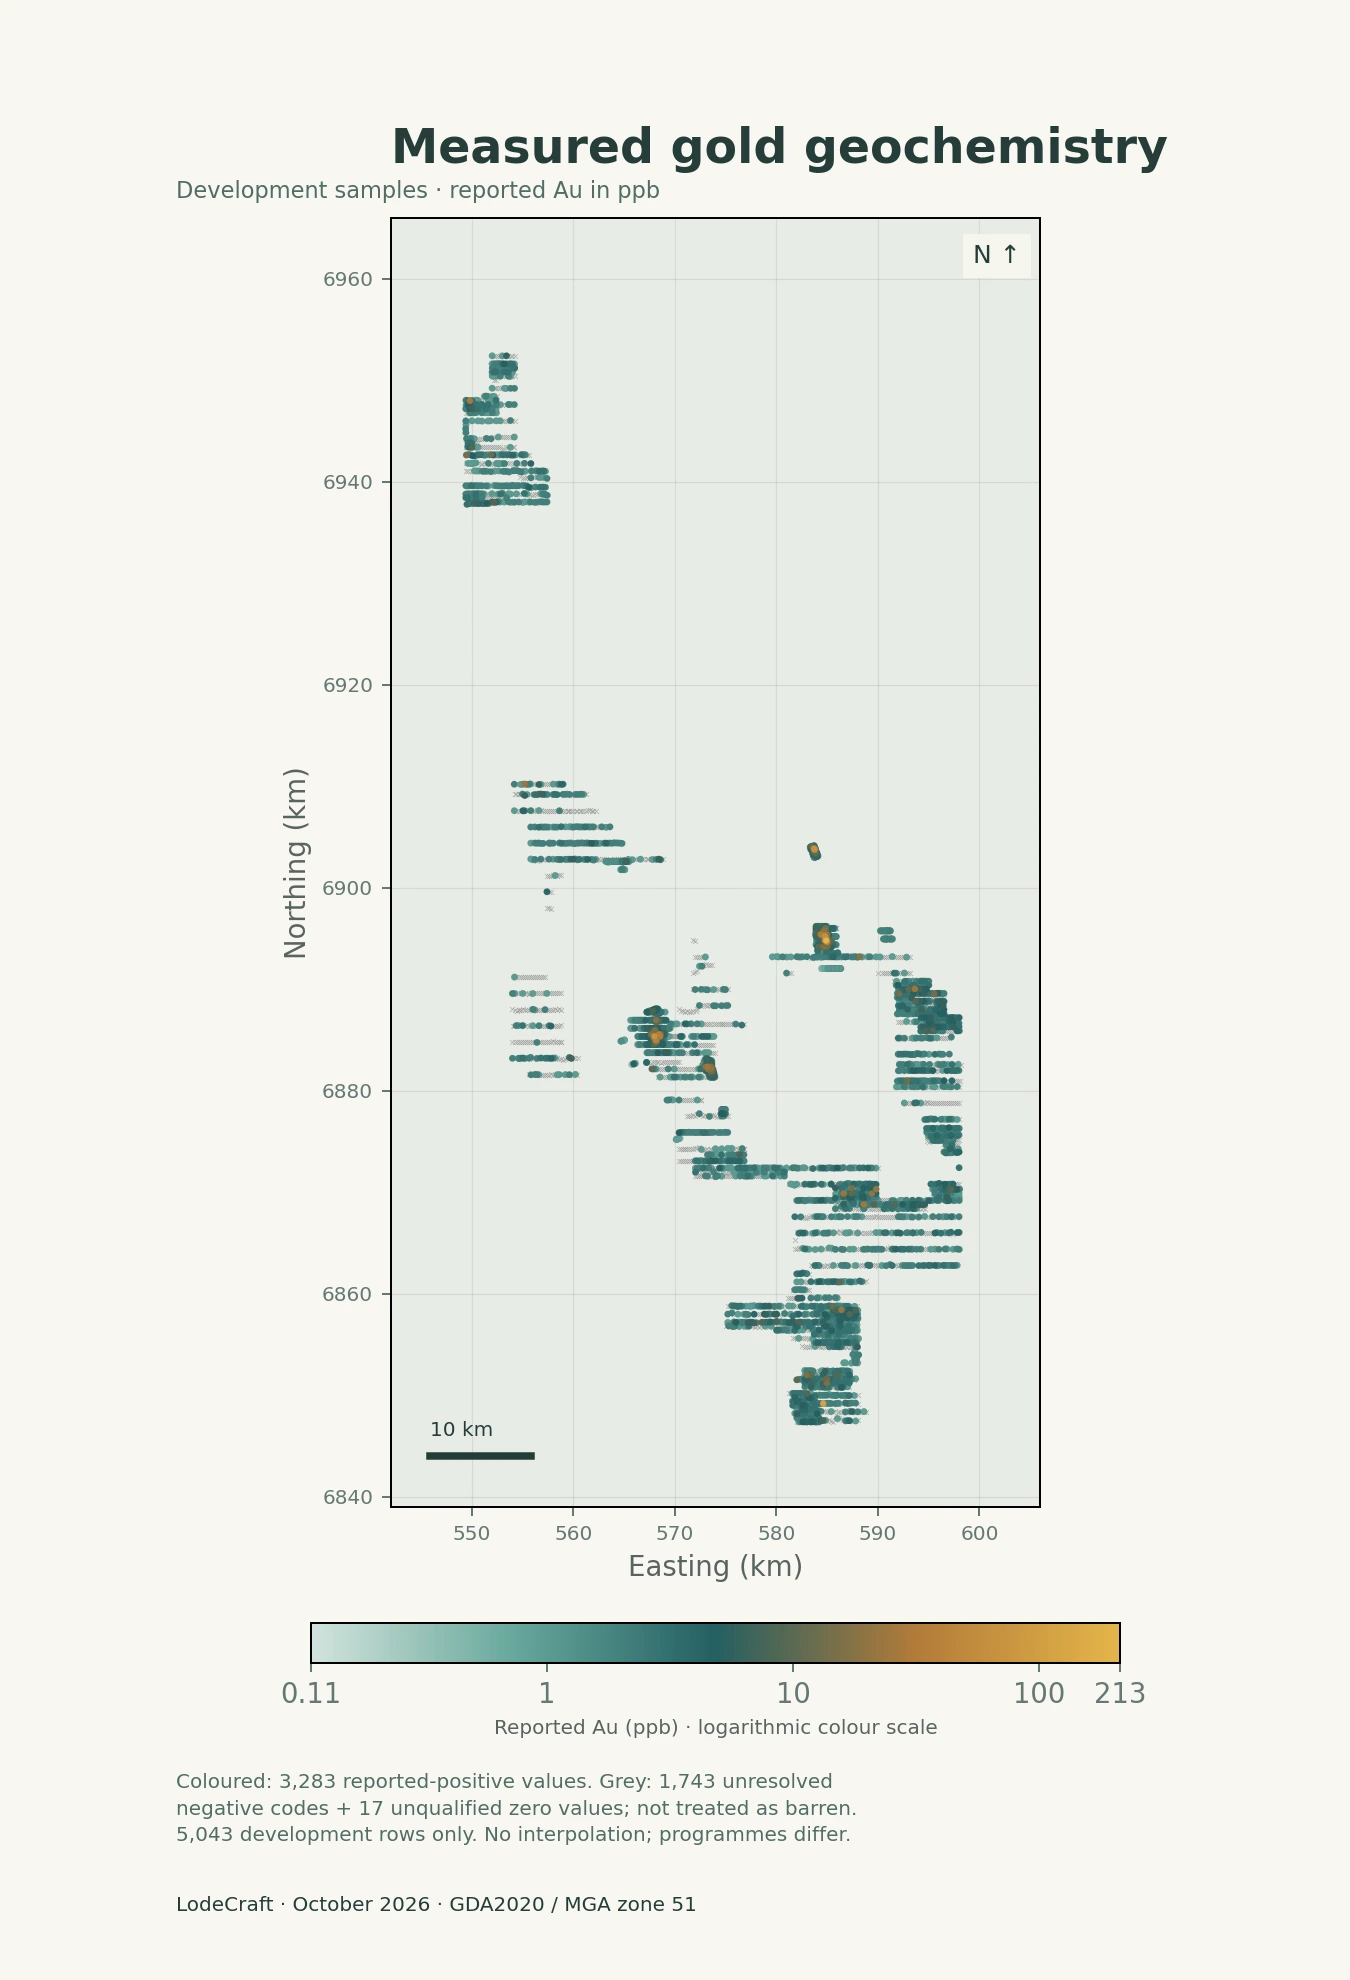
Follow the evidence from measured gold and magnetic context to regional machine-learning response and candidate review areas. Each view answers a different question and points to the next useful geological review.

Analysis completed in 2026 using mixed-vintage inputs, including a 2019 geophysical compilation. This is a retrospective study, not a forecast made before the reported drilling.

8,013Assay records retained within the study area
3 programmesWMC · Asarco · Gold Road
Evidence → reviewMeasurements, model response and candidate areas
October 2026Current analysis · historical source evidence

01 / Evidence, response and review

One region.
Different questions.

Start with the ML response, then inspect candidate boundaries and the measured evidence. The final view shows where two similar ML methods disagree. Each map has a distinct role; different colours alone do not establish different scientific conclusions.

01 / Regional response

See the regional pattern.

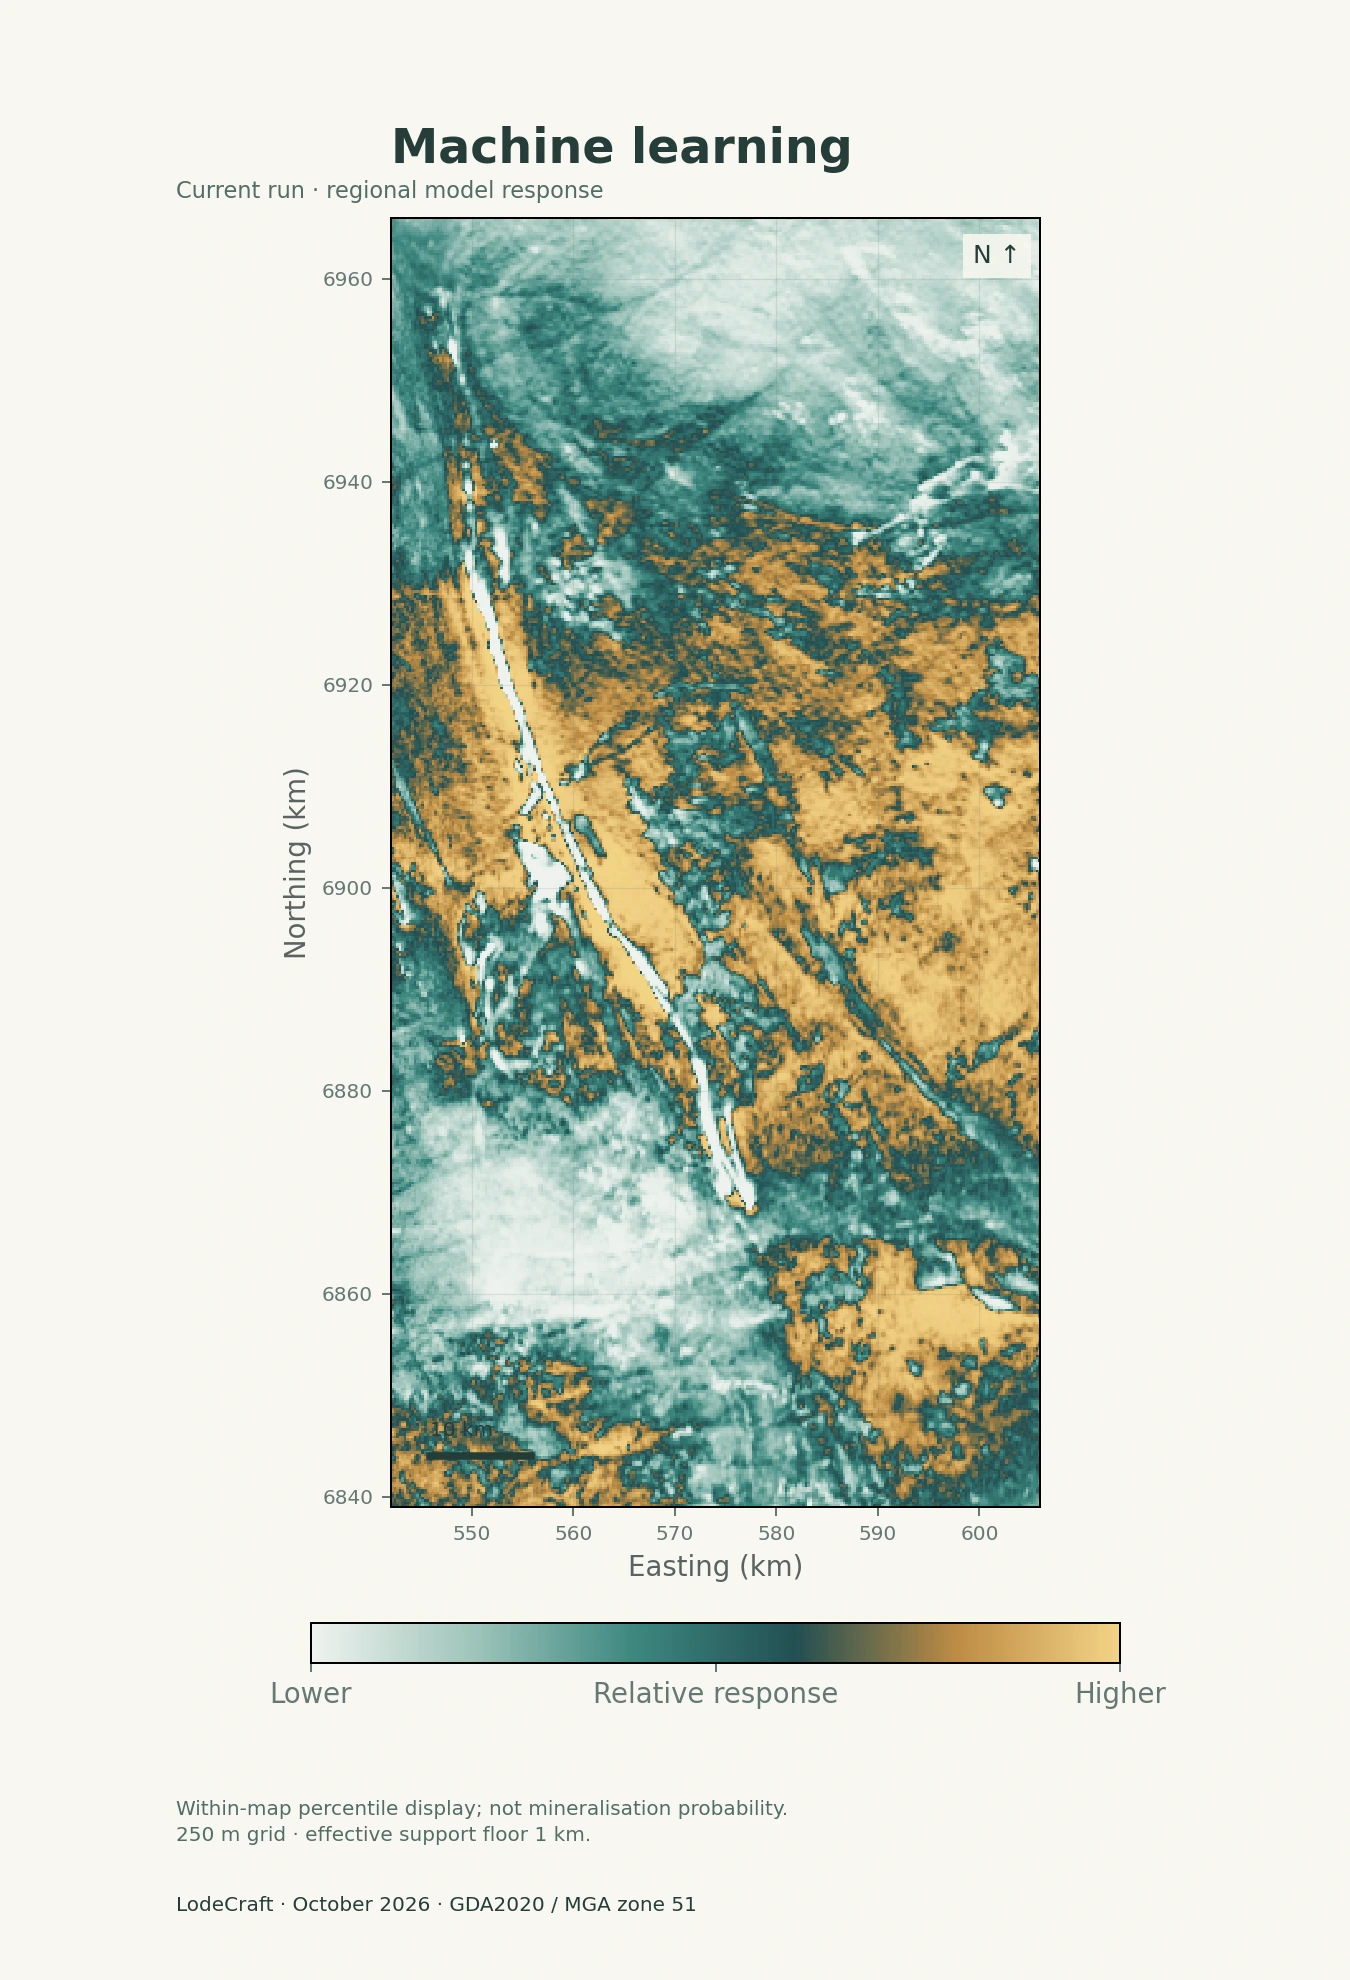
This ensemble ML map expresses the relative response learned from historical assay outcomes and geophysical predictors. It helps locate broad patterns for closer review.

Reading this map

Lower to higher relative model response

Colour is a within-map percentile, not a probability of gold. Historical assays influenced model fitting.

Open full-resolution map ↗
100%
Same regional extent. Original geometry. October 2026 outputs.
Current Yamarna ensemble machine-learning response map, with a sequential scale and full study extent.

02 / Bring the evidence to a place

From regional patterns
to local questions.

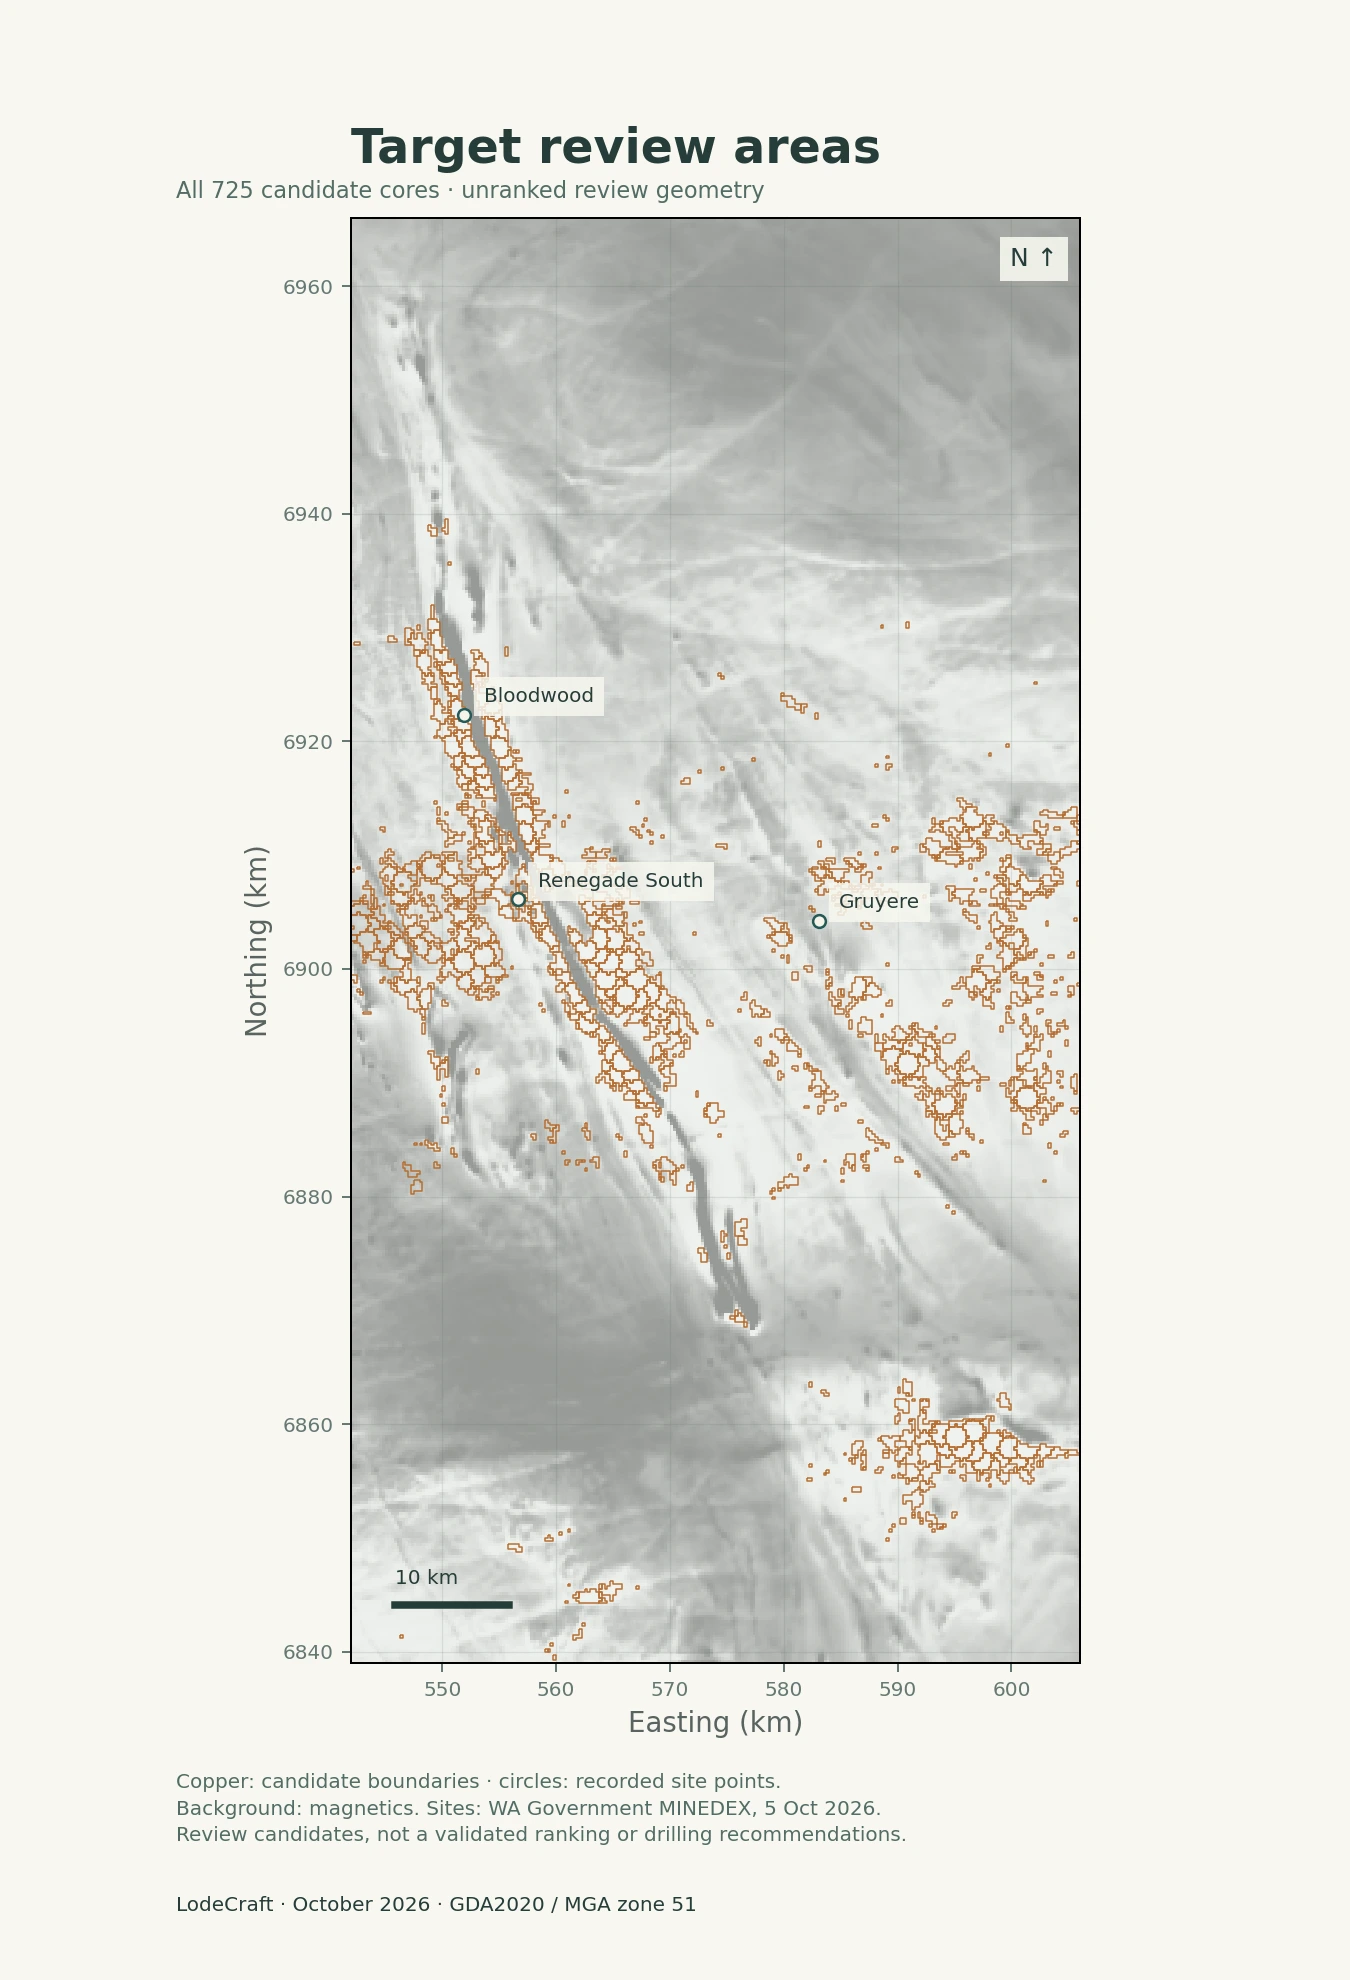
Known sites help put the current geometry in context. The following examples show exact overlaps and a near miss; they are selected explanations, not a performance sample.

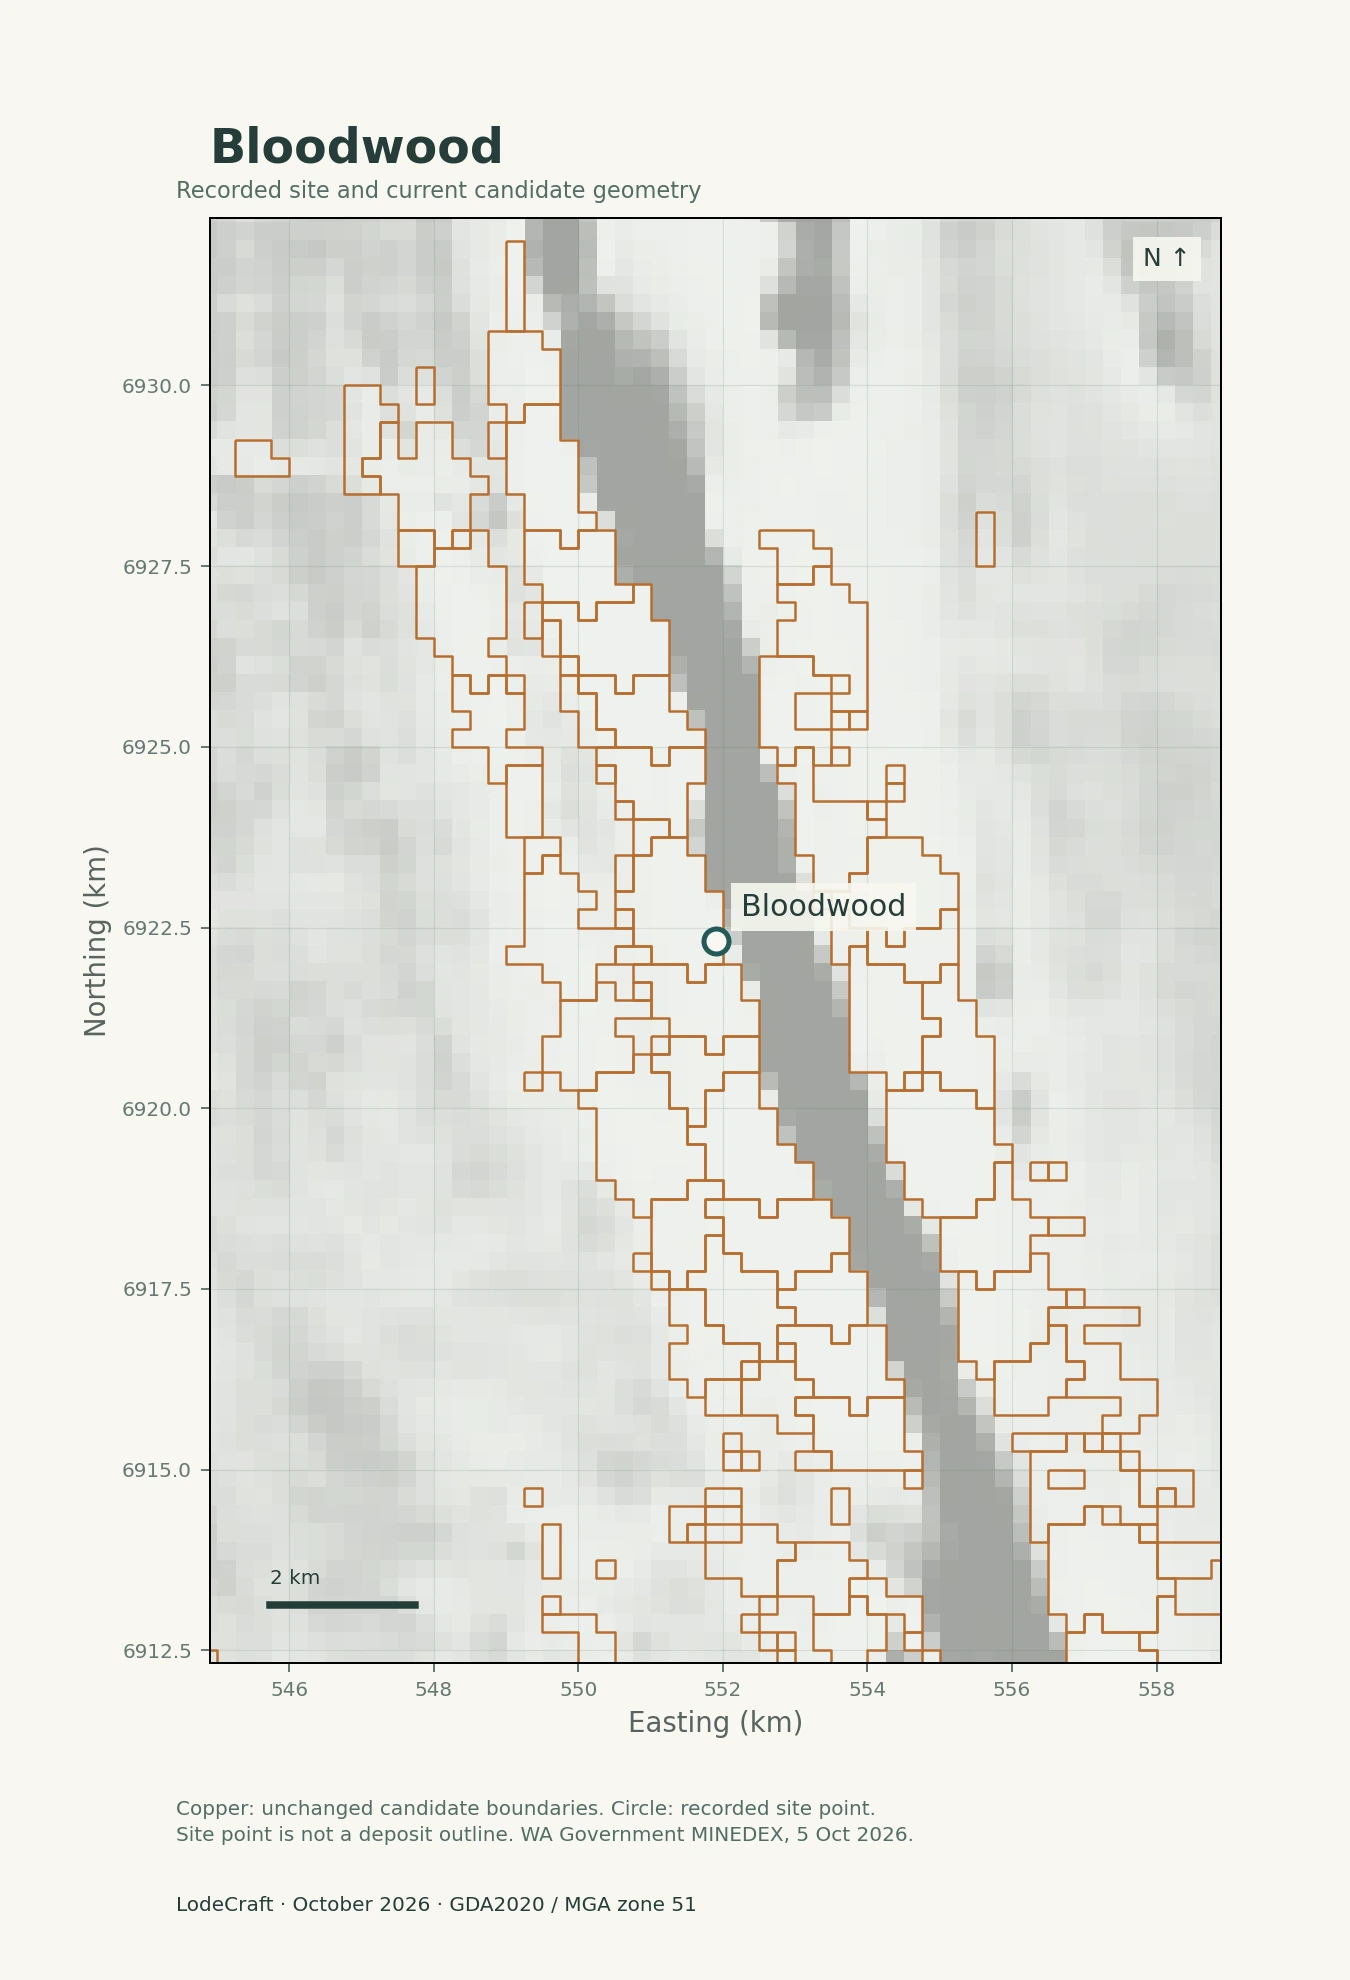
Bloodwood recorded prospect point inside the current candidate core.

Bloodwood

The recorded prospect point sits inside a current candidate core.

Gold Road reported mineralised aircore drilling in 2018 and bedrock diamond drilling in 2019. Those milestones are later than the dated development assays in this study.

Next review: compare the candidate extent with the published drill sections and mineralised intervals.

2018 exploration report ↗ · 2019 drilling report ↗
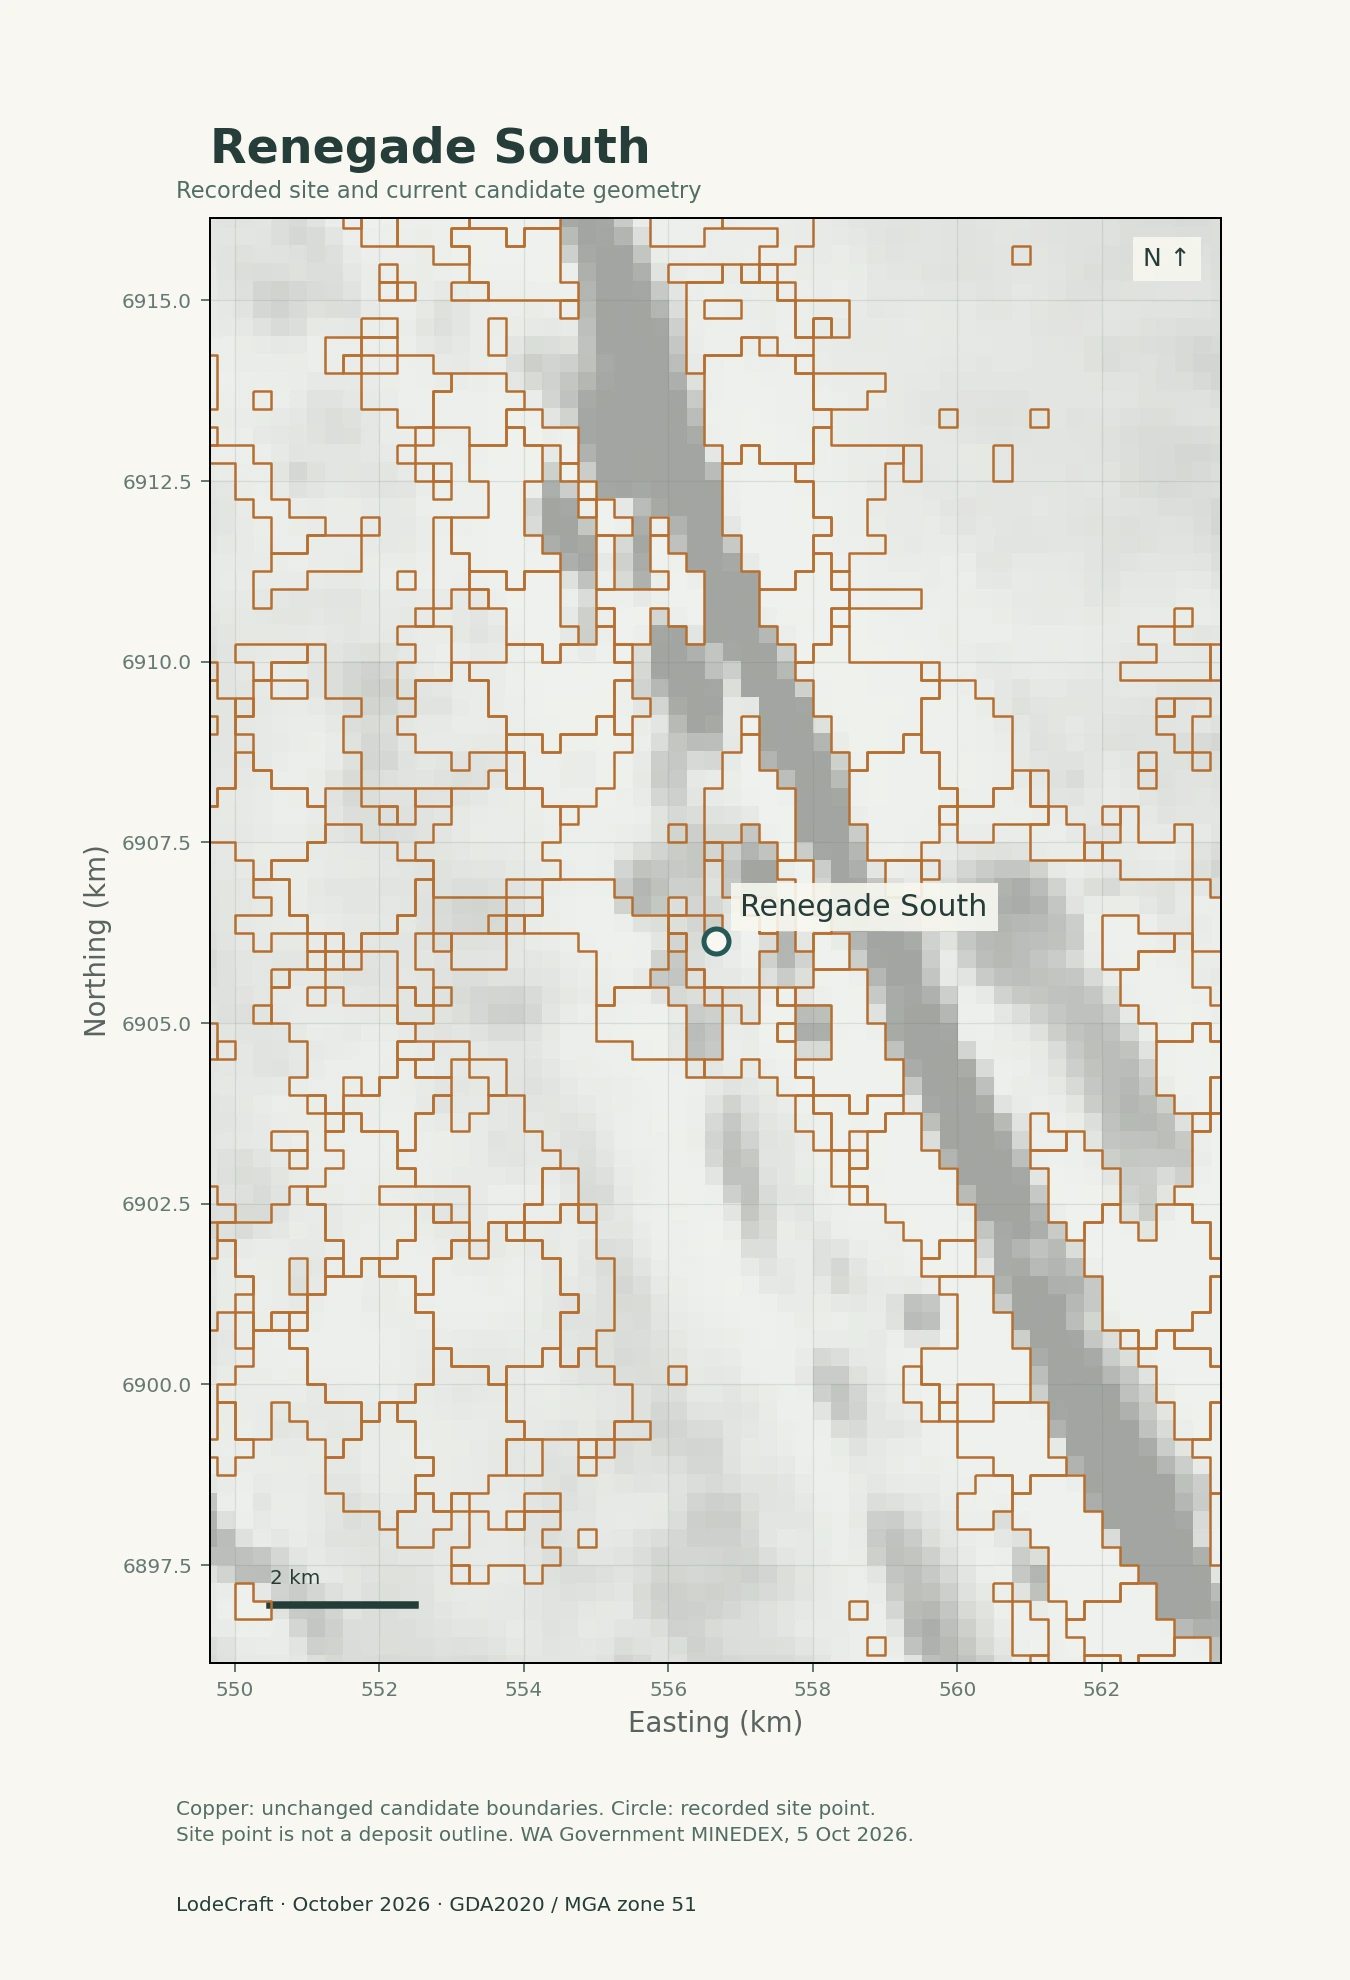
Renegade South recorded prospect point inside the current candidate core.

Renegade South

The current candidate geometry includes the recorded prospect location.

A nine-hole programme completed in early 2022 reported mineralisation along this trend. This is a documented drilling milestone; the earliest recognition of the prospect remains to be established.

Next review: reconcile historical sampling dates and locations with the published drilling.

June 2022 quarterly report, p.11 ↗
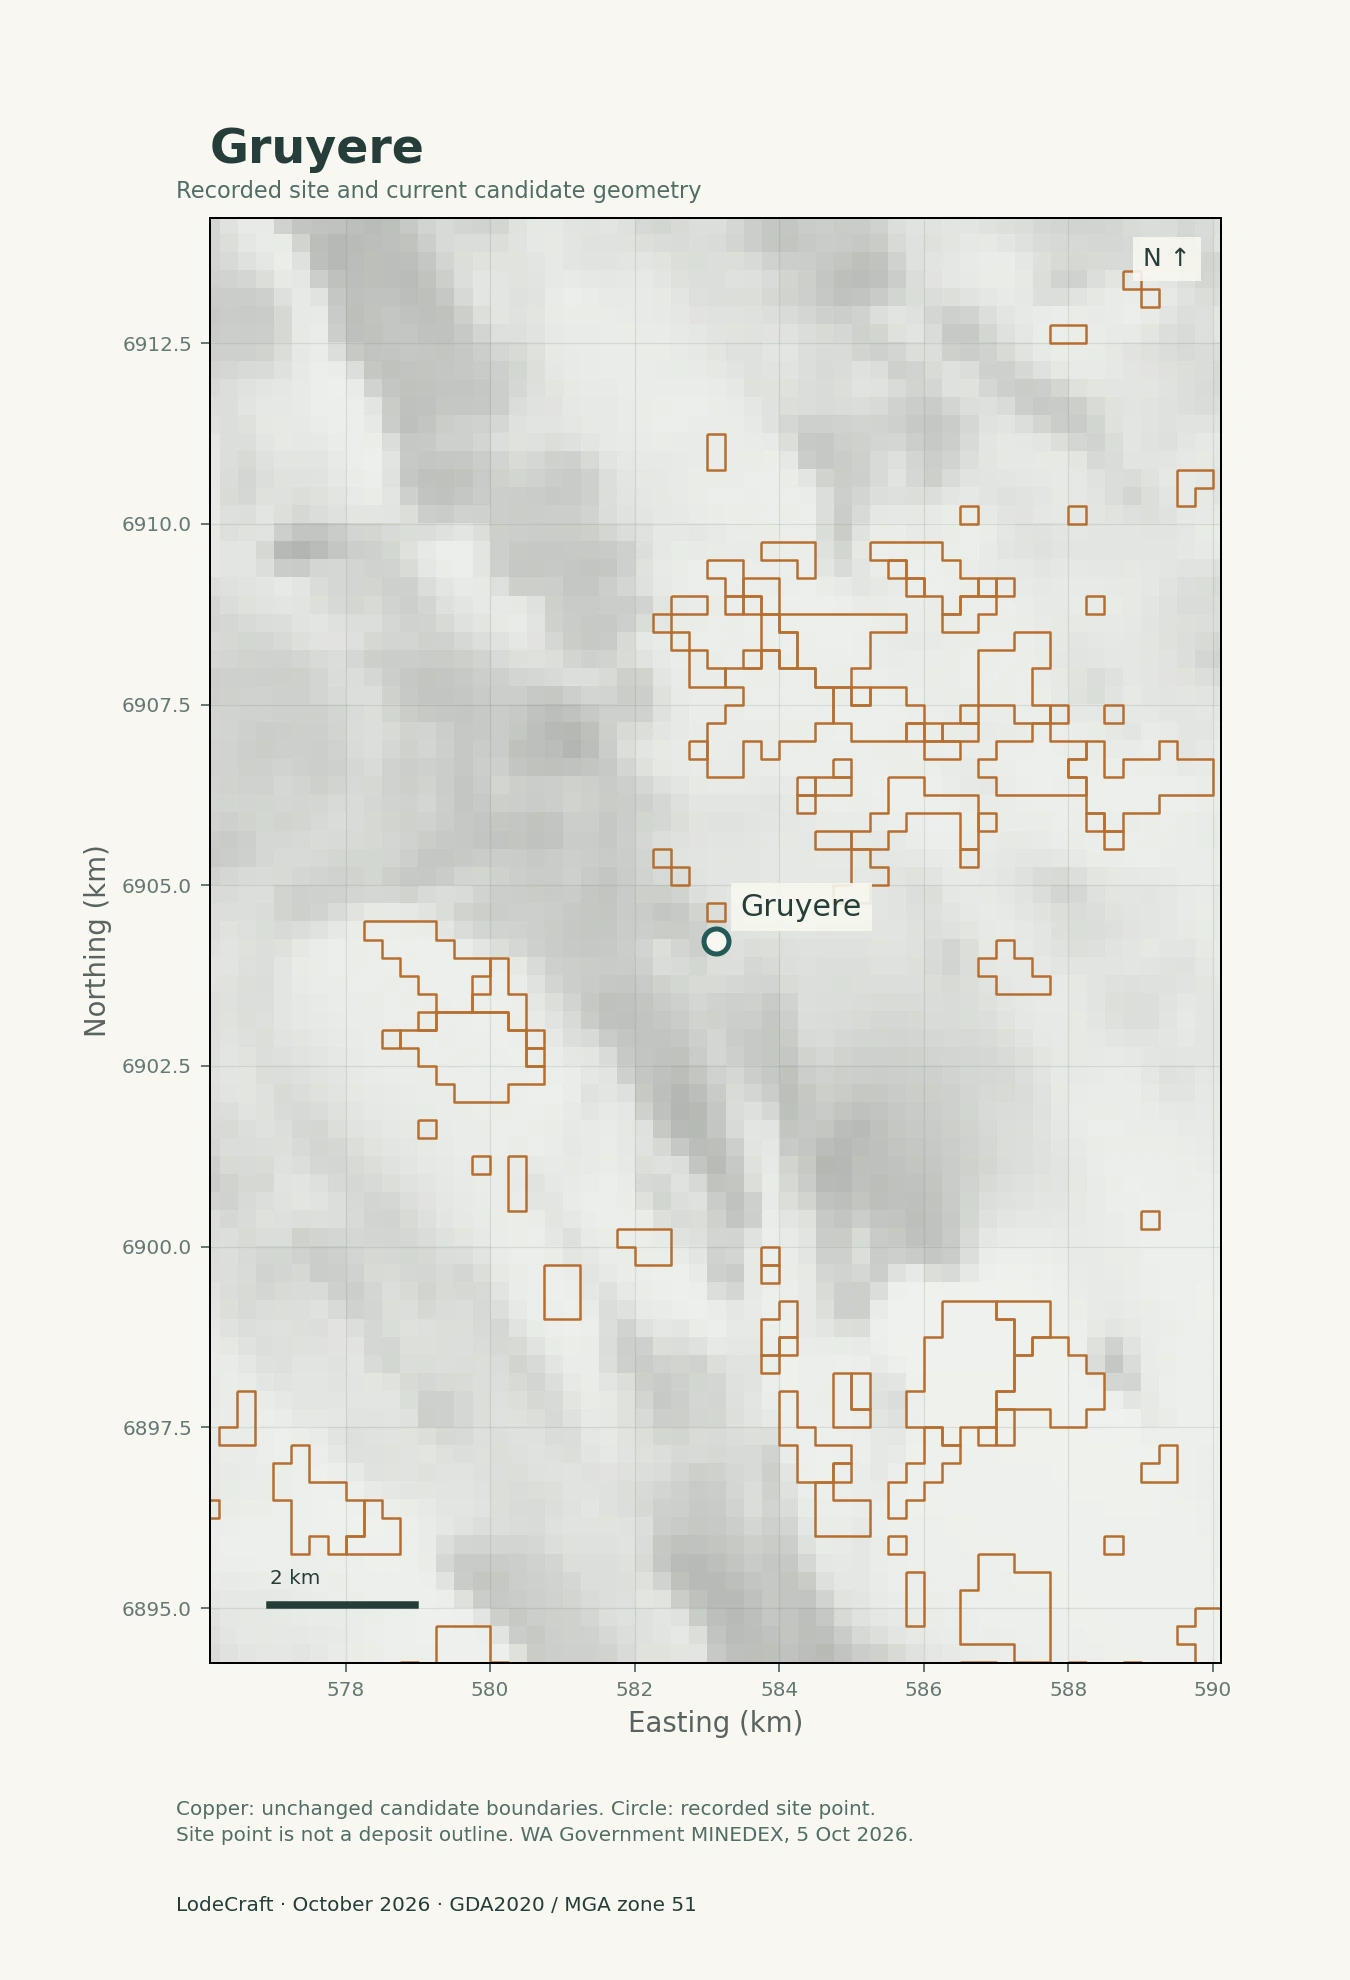
Gruyere recorded mine point outside the exact candidate core, approximately 264 metres away.

Gruyere

The recorded mine point is about 264 m from the nearest core, inside its broader investigation envelope.

A near miss at a site point is different from an orebody assessment. The full deposit footprint may have a different relationship to the candidate geometry.

Next review: examine actual deposit extents at the model’s effective support scale.

Site coordinates: WA Government MINEDEX, extract dated 5 October 2026. Points are not deposit outlines.

The wider picture matters: 4 of 51 recorded gold mine, deposit and prospect records in the study grid lie inside the current cores; 15 lie inside their broader investigation envelopes, including those four. Gilmour’s recorded deposit point lies outside both. These are descriptive spatial overlaps, not accuracy or discovery rates.

03 / What was known, and when?

An old archive.
A present-day analysis.

The dates make the study more informative. Much of the assay evidence predates the reported Bloodwood and Renegade South drilling. The newer geophysical compilation adds another vintage of information.

1997–2013

Historical development samples

WMC dated samples: 1997–1998. Asarco’s programme: 2002–2003, with laboratory results into January 2004. Gold Road development samples: April–September 2013.

Dates were checked against the original records for the 5,043 development rows. Some dates are missing, and historical availability is not fully verified.

2019

Geophysical compilation

Magnetic and radiometric products provide regional context. The product edition is dated 2019; individual surveys may have been acquired earlier.

A compilation date is different from a survey date. This is why the study does not have a single verified “2013 cutoff”.

2018–2022

Reported drilling milestones

Bloodwood: mineralised aircore reported in 2018 and bedrock drilling in 2019. Renegade South: drilling confirmation reported in 2022.

These milestones postdate the dated development assays. They do not establish when each anomaly or prospect was first recognised.

October 2026 / LodeCraft analysisWe examine these relationships today using historical assays and newer geophysical products. Testing what could have been prioritised at an earlier date requires a separate, fixed historical information cutoff. Central Bore was initially discovered in 1994 and Savoie’s soil anomaly was known by 2000; neither supports a later-discovery narrative here.

04 / Make the evidence useful

A map you can inspect.
A question you can act on.

The value is in connecting the archive, seeing how different approaches express the evidence, and defining the next geological review. MindSync delivers that work as a service, using LodeCraft internally.

Revisit the archive

Keep source programmes, dates and uncertainty attached. Preserve the distinction between a measured assay, a model response and a reported drilling result.

Separate evidence from response

Inspect measured gold and magnetics, the regional ML response and the candidate geometry. The model-difference view shows where two similar methods disagree without presenting their agreement as independent confirmation.

Continue in GIS

The current package contains 97 checked QGIS layers and the complete candidate geometry. It supports inspection of the evidence and preparation of local follow-up questions.

Methodology: experimental DL diagnostic

Learned patterns at sample locations

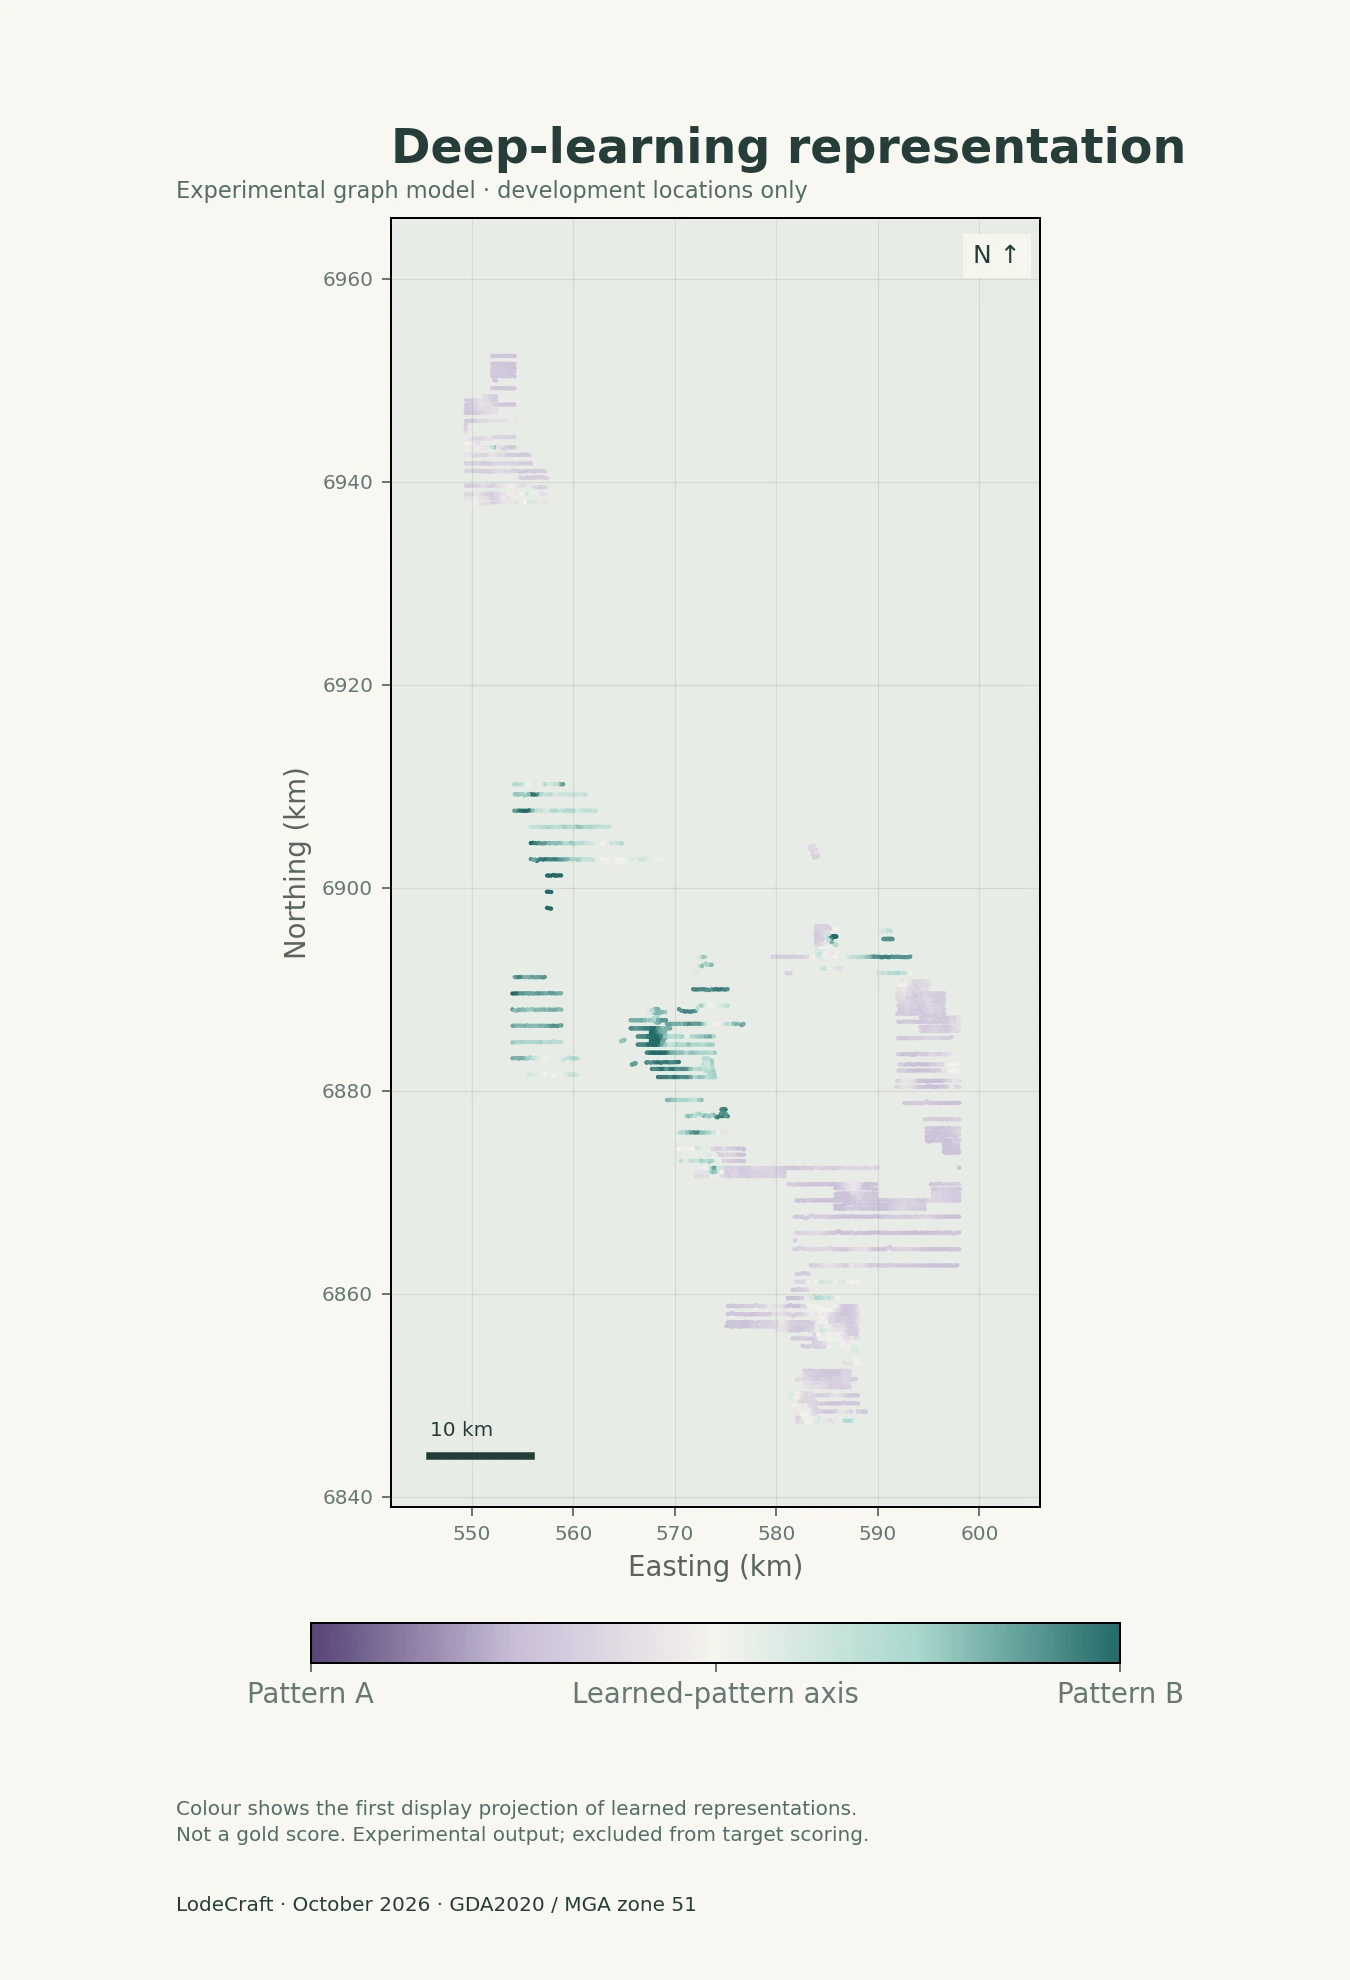
This graph deep-learning model produced a representation for each sample, rather than a continuous regional gold-prediction surface. The plot shows the first display component of those existing representations at 5,043 development locations.

The dots follow the sampling footprint. Their colours are learned-pattern values, not measured gold grades or predicted mineralisation. The first component captures about 50.3% of variation in the displayed embeddings; this is a display statistic, not predictive performance.

Experimental only: this output remains operationally unqualified and does not contribute to the selected target score. The separate geochemical DL ranking has zero valid cells, so no regional DL prediction is presented.

Open the experimental DL diagnostic ↗
Experimental DL diagnostic at development sample locations; colours are learned patterns, not assay values or regional gold predictions.
Methodology diagnostic · sample locations only · excluded from target scoring.
Study record, sample support and interpretation limits

Current presentation: October 2026 gold study. It contains 725 unranked candidate cores and no eligible scientific target ranking. All 8,013 within-area assay records were retained: 6,273 WMC, 718 Asarco and 1,022 Gold Road. The fixed population includes 5,043 development, 1,746 reserved and 1,224 buffered rows. The present narrative and date check use development evidence, not reserved assay outcomes.

Gold assay outcomes informed ML fitting; gold was not supplied as its own predictor raster. The reported-positive endpoint is an eligible analytical gold value above zero, not a geological anomaly threshold. The selected candidate score uses the two ML responses. The displayed experimental DL representation is separate and does not enter that score.

The DL map is a display-only first-component projection of existing graph-model embeddings, restricted to development sample locations. Its operational status remains blocked and it is not qualified for target scoring. The separate geochemical DL rank has zero valid cells and is not displayed as a prediction map.

Development assays: core / surrounding 1 km ring median Au, ppb
Source cohortCore / ringNumeric records, core / ring
WMC2 / 2214 / 523
Asarco soil 015 / 2134 / 228
Gold Road surface 012 / 268 / 288

Assay support varies by programme. These development-data summaries are descriptive, not independent validation. Only 79 of the 725 cores contain an included development sample. Absence from this sample comparison does not establish barren or historically unsampled ground.

All maps preserve source geometry. The main ML colours are within-map percentiles; the difference map subtracts percentile rankings on shared valid cells. Measured gold uses a logarithmic ppb scale without interpolation. The separate DL diagnostic shows learned-pattern variation. The computational grid is 250 m with an effective support floor of 1 km. Candidate overlaps use recorded site points, not orebody boundaries. The map catalogue is descriptive and does not establish mineralisation probabilities, new discoveries or drilling recommendations.

Inspect the displayed map identities and file hashes ↗

Sources and chronology references
  • Assays: WMC Yamarna geochemistry; Asarco 2002–2003 programme; Gold Road 2013 surface sampling, from the preserved source reports.
  • Geophysics: Geoscience Australia 2019 magnetic and radiometric compilations.
  • WA Government MINEDEX, 5 October 2026 extract. Source of the recorded site-location overlays.
  • Central Bore history, p.36: initial discovery in 1994.
  • Savoie history, p.8: soil anomaly known by 2000.

Retrospective case study by MindSync Technologies. References to exploration companies describe published source evidence and do not imply a client engagement or endorsement.

Start with the evidence you already hold

What could your archive
help you see?

Bring your area, commodity and existing geological data. We can assess the available evidence, the questions it can support and a useful scope for review.

Discuss your project →